Electricity production per capita in world regions
Trends in electricity generation from different energy sources globally and in major world regions between 2000 and 2019. The amount of electricity produced is expressed in kWh per capita per year.
Table of Contents
How to read this graph
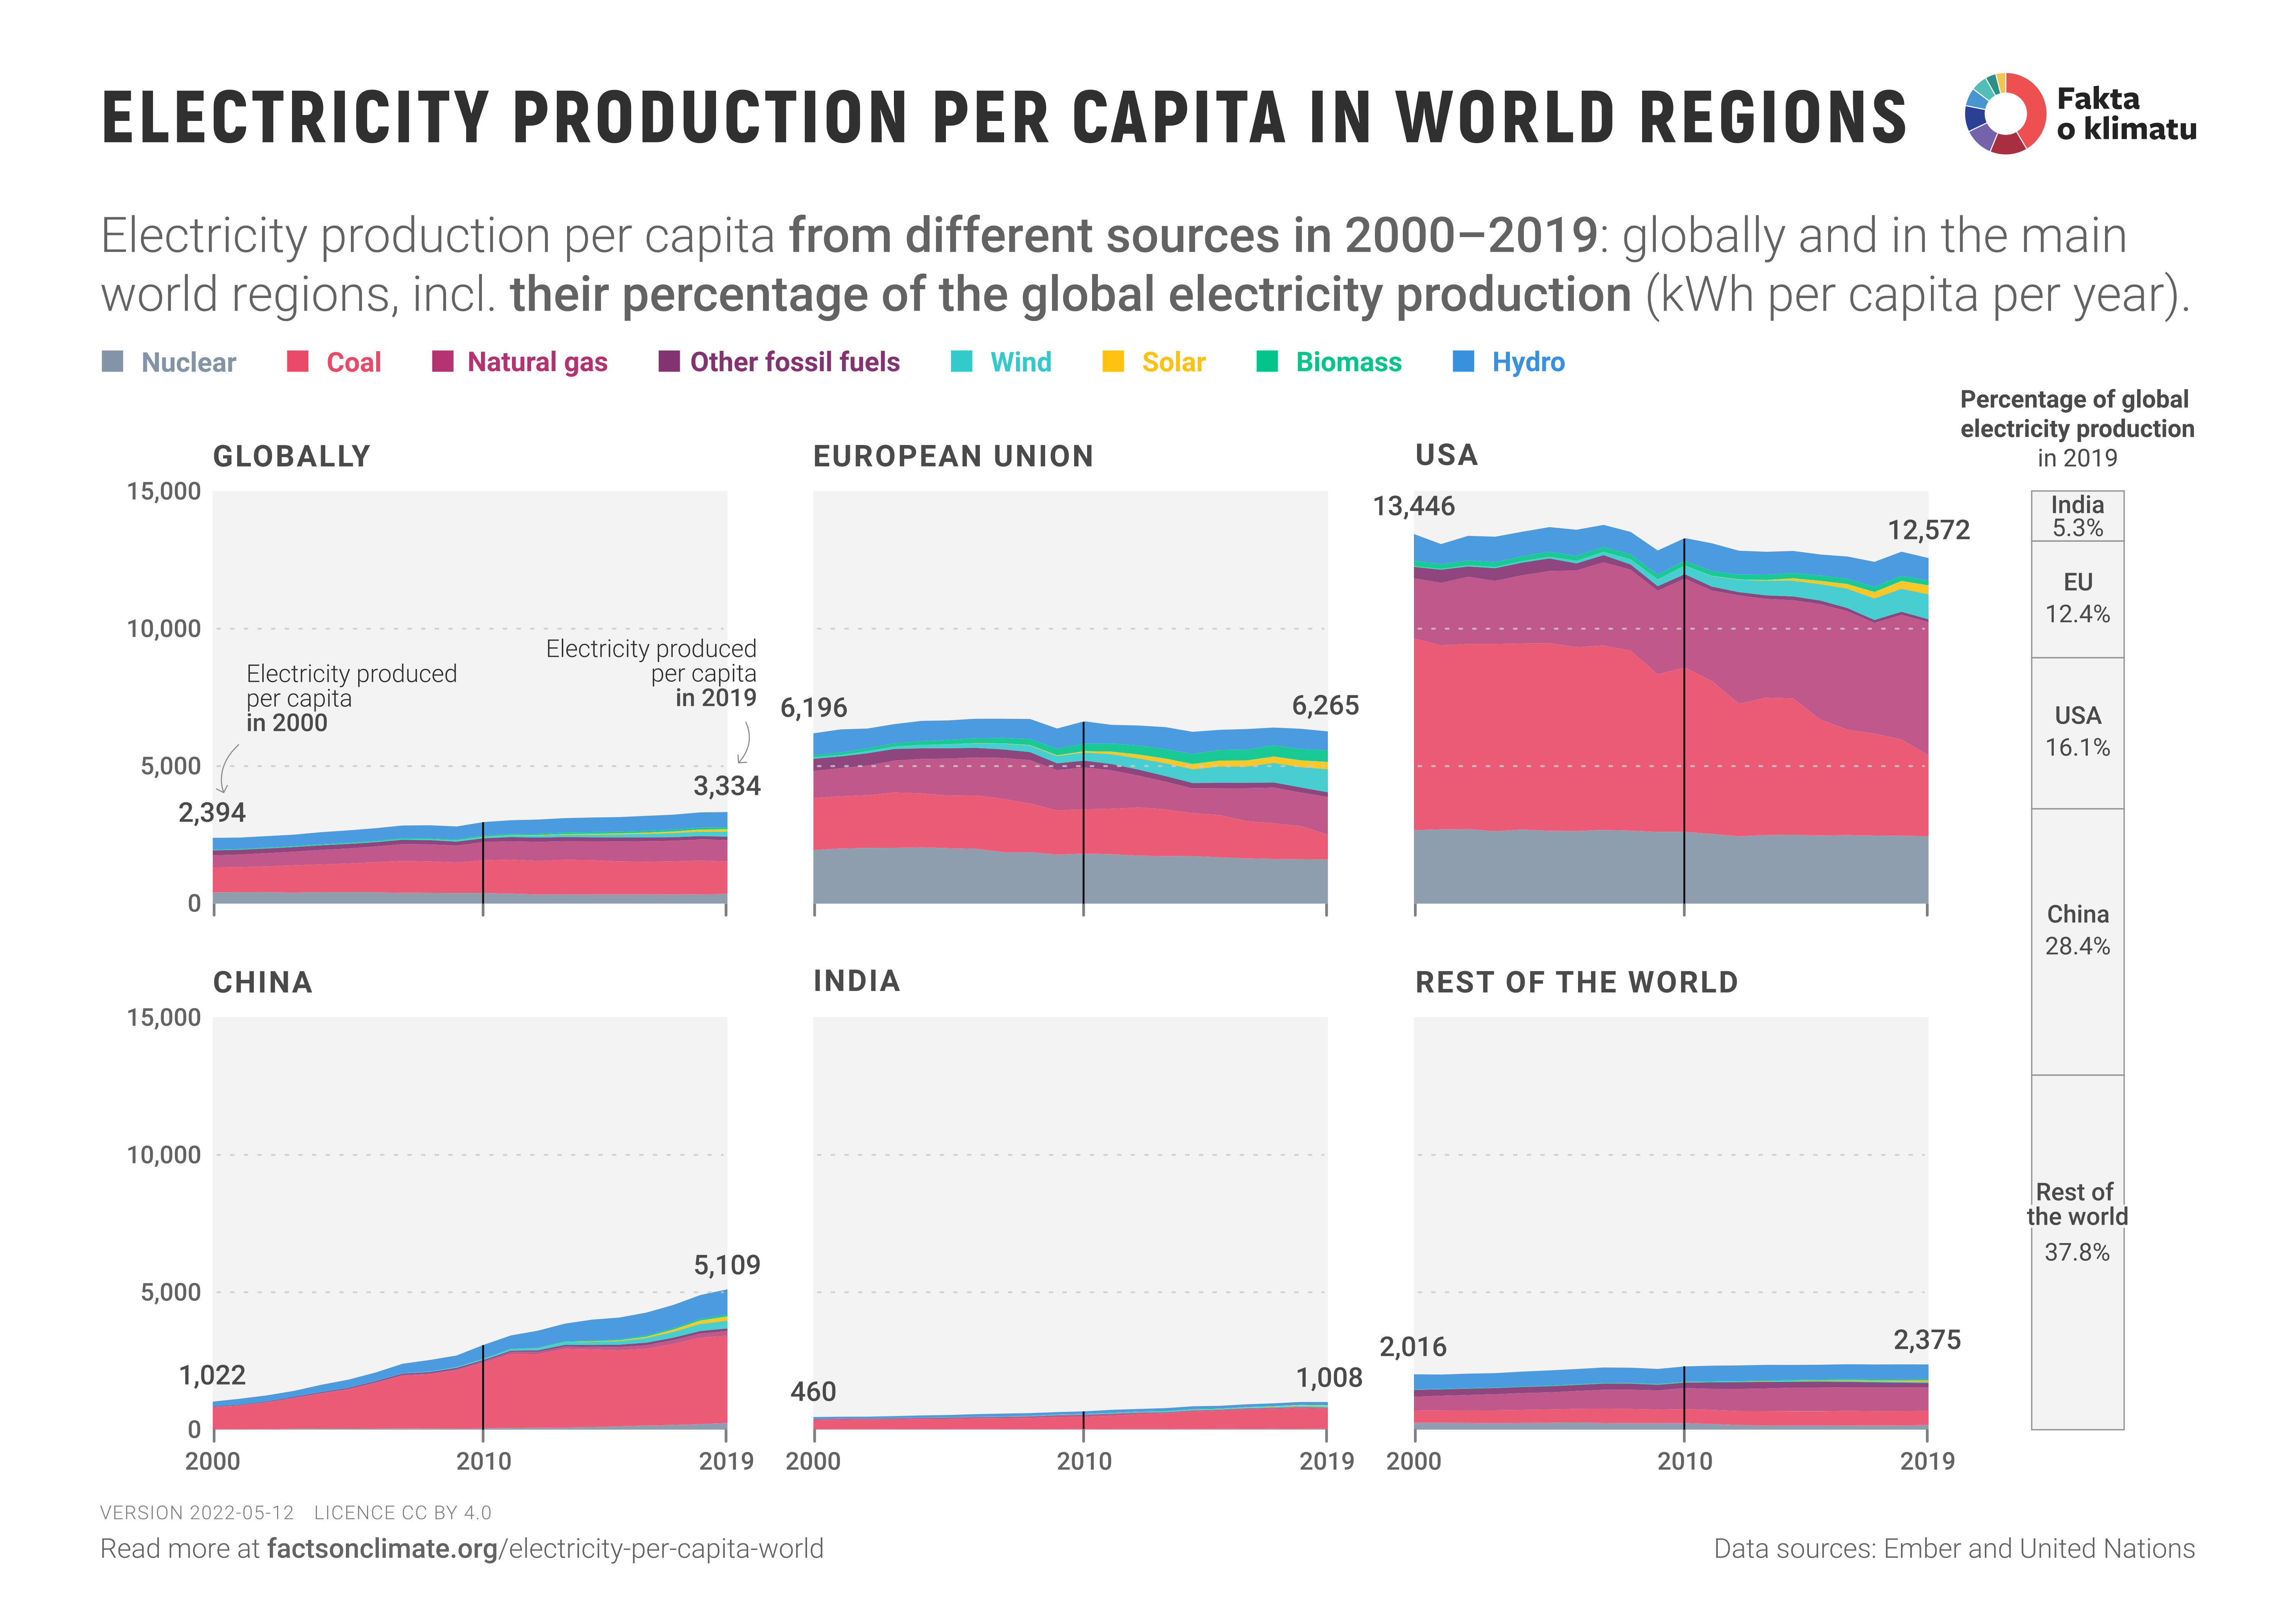
- The graph shows the worldwide development of electricity produced per person by individual sources in the years 2000-2019, as well as a comparison of selected world regions. Values are given in kWh of electricity produced per person per year.
- All graphs have the same vertical axis, so for regions with low average consumption per person, the filled part occupies only a minimal portion of the graph.
- However, the per capita comparison does not account for the different sizes of the regions, so the right column completes the regions’ share of total global electricity generation in 2019. The supplementary infographic, Electricity generation in world regions, compares regions in terms of total electricity generation.
Comments on the graph
- Electricity production per person in the Czech Republic in 2019 was 8,066 kWh, significantly higher than the averages in the regions shown, except for the USA. The Czech Republic is also a significant exporter of electricity, so the average electricity consumption per person was lower, at 6,891 kWh. Even this value is more than double the world average.
- Globally, electricity production increased by 75% between 2000 and 2019, while at the same time, the global population has grown by 1.6 billion people. In per capita terms, electricity generation increased by 39%, and in absolute terms, there was an increase in electricity production by all electricity generation sources except in the nuclear sector. The share of coal in electricity production fell slightly (from 37.9% to 35.2%), and the percentage of nuclear power fell even more significantly (from 16.9% to 10.5%). In contrast, there was an increase in the share of natural gas (from 18.2 % to 23.5%) and renewable sources (from 19.5% to 27.3% due to the development of wind and solar power plants).
-
Trends of individual regions observed from the graph:
- In the European Union, electricity consumption is virtually unchanged per capita, but there is a significant substitution of coal for renewables in electricity generation.
- Electricity consumption per person in the USA has fallen slightly but is still many times higher than the world average. Since 2007, there has been a decrease in the share of coal in electricity production, which is, however, being replaced mainly by natural gas, as well as partly by renewable sources.
- In China, the per capita electricity consumption increased fivefold between 2000 and 2019, with average consumption already at 82% of the European Union average. There has been an increase in the capacity of all sources of electricity generation, yet coal is still the dominant source in China, with a 62% share. On a per capita basis, China generated 3,180 kWh from coal in 2019, which is the most of the regions shown. By comparison, the Czech Republic produced 3,439 kWh per person from coal in the same year.
- India has more than doubled its per capita electricity generation over this period, but this production is still less than a third of the global average. Coal is still the dominant source of electricity generation, with a 72% share, while other sources are also gradually developing.
- The Rest of the World represents a very diverse group, where electricity production per person in some countries exceeds the USA (i.e., in Canada or the oil countries of the Middle East). In contrast, in many other countries, it is lower than in India (usually in African and some Asian countries).
- The chart shows the electricity produced in each region, not consumed. For example, in the case of the Czech Republic, net exports make up almost 15% of the electricity produced. However, for the prominent regions in the graph, imports and exports are practically negligible: below 1% for all regions.
- Electricity represents only a fraction of total energy consumption; for example, most energy used for transport or heating is not included in the graph (as it is direct fossil fuel combustion, not electricity).
- The chart does not include other renewable sources with a marginal share of production (e.g. geothermal energy), accounting for 0.4% of electricity production worldwide.
Data sources
- The base for the infographic is data from the Ember organization (formerly known as Sandbag). It is an independent climate think-tank focused on supporting the transition from coal to clean sources of electricity.
- Ember relies primarily on Eurostat data for the European Union, national databases for the US, China, India and other major countries, and the US Department of Energy’s International Data Section for the rest of the world.
- One of the main activities of the Ember think tank is the publication of reports on electricity production in the European Union. In 2020, it also published a report on global electricity production. The infographic’s base is the dataset attached to this report.
- The infographic uses population data from the United Nations.


")