Emission pathways towards Paris agreement
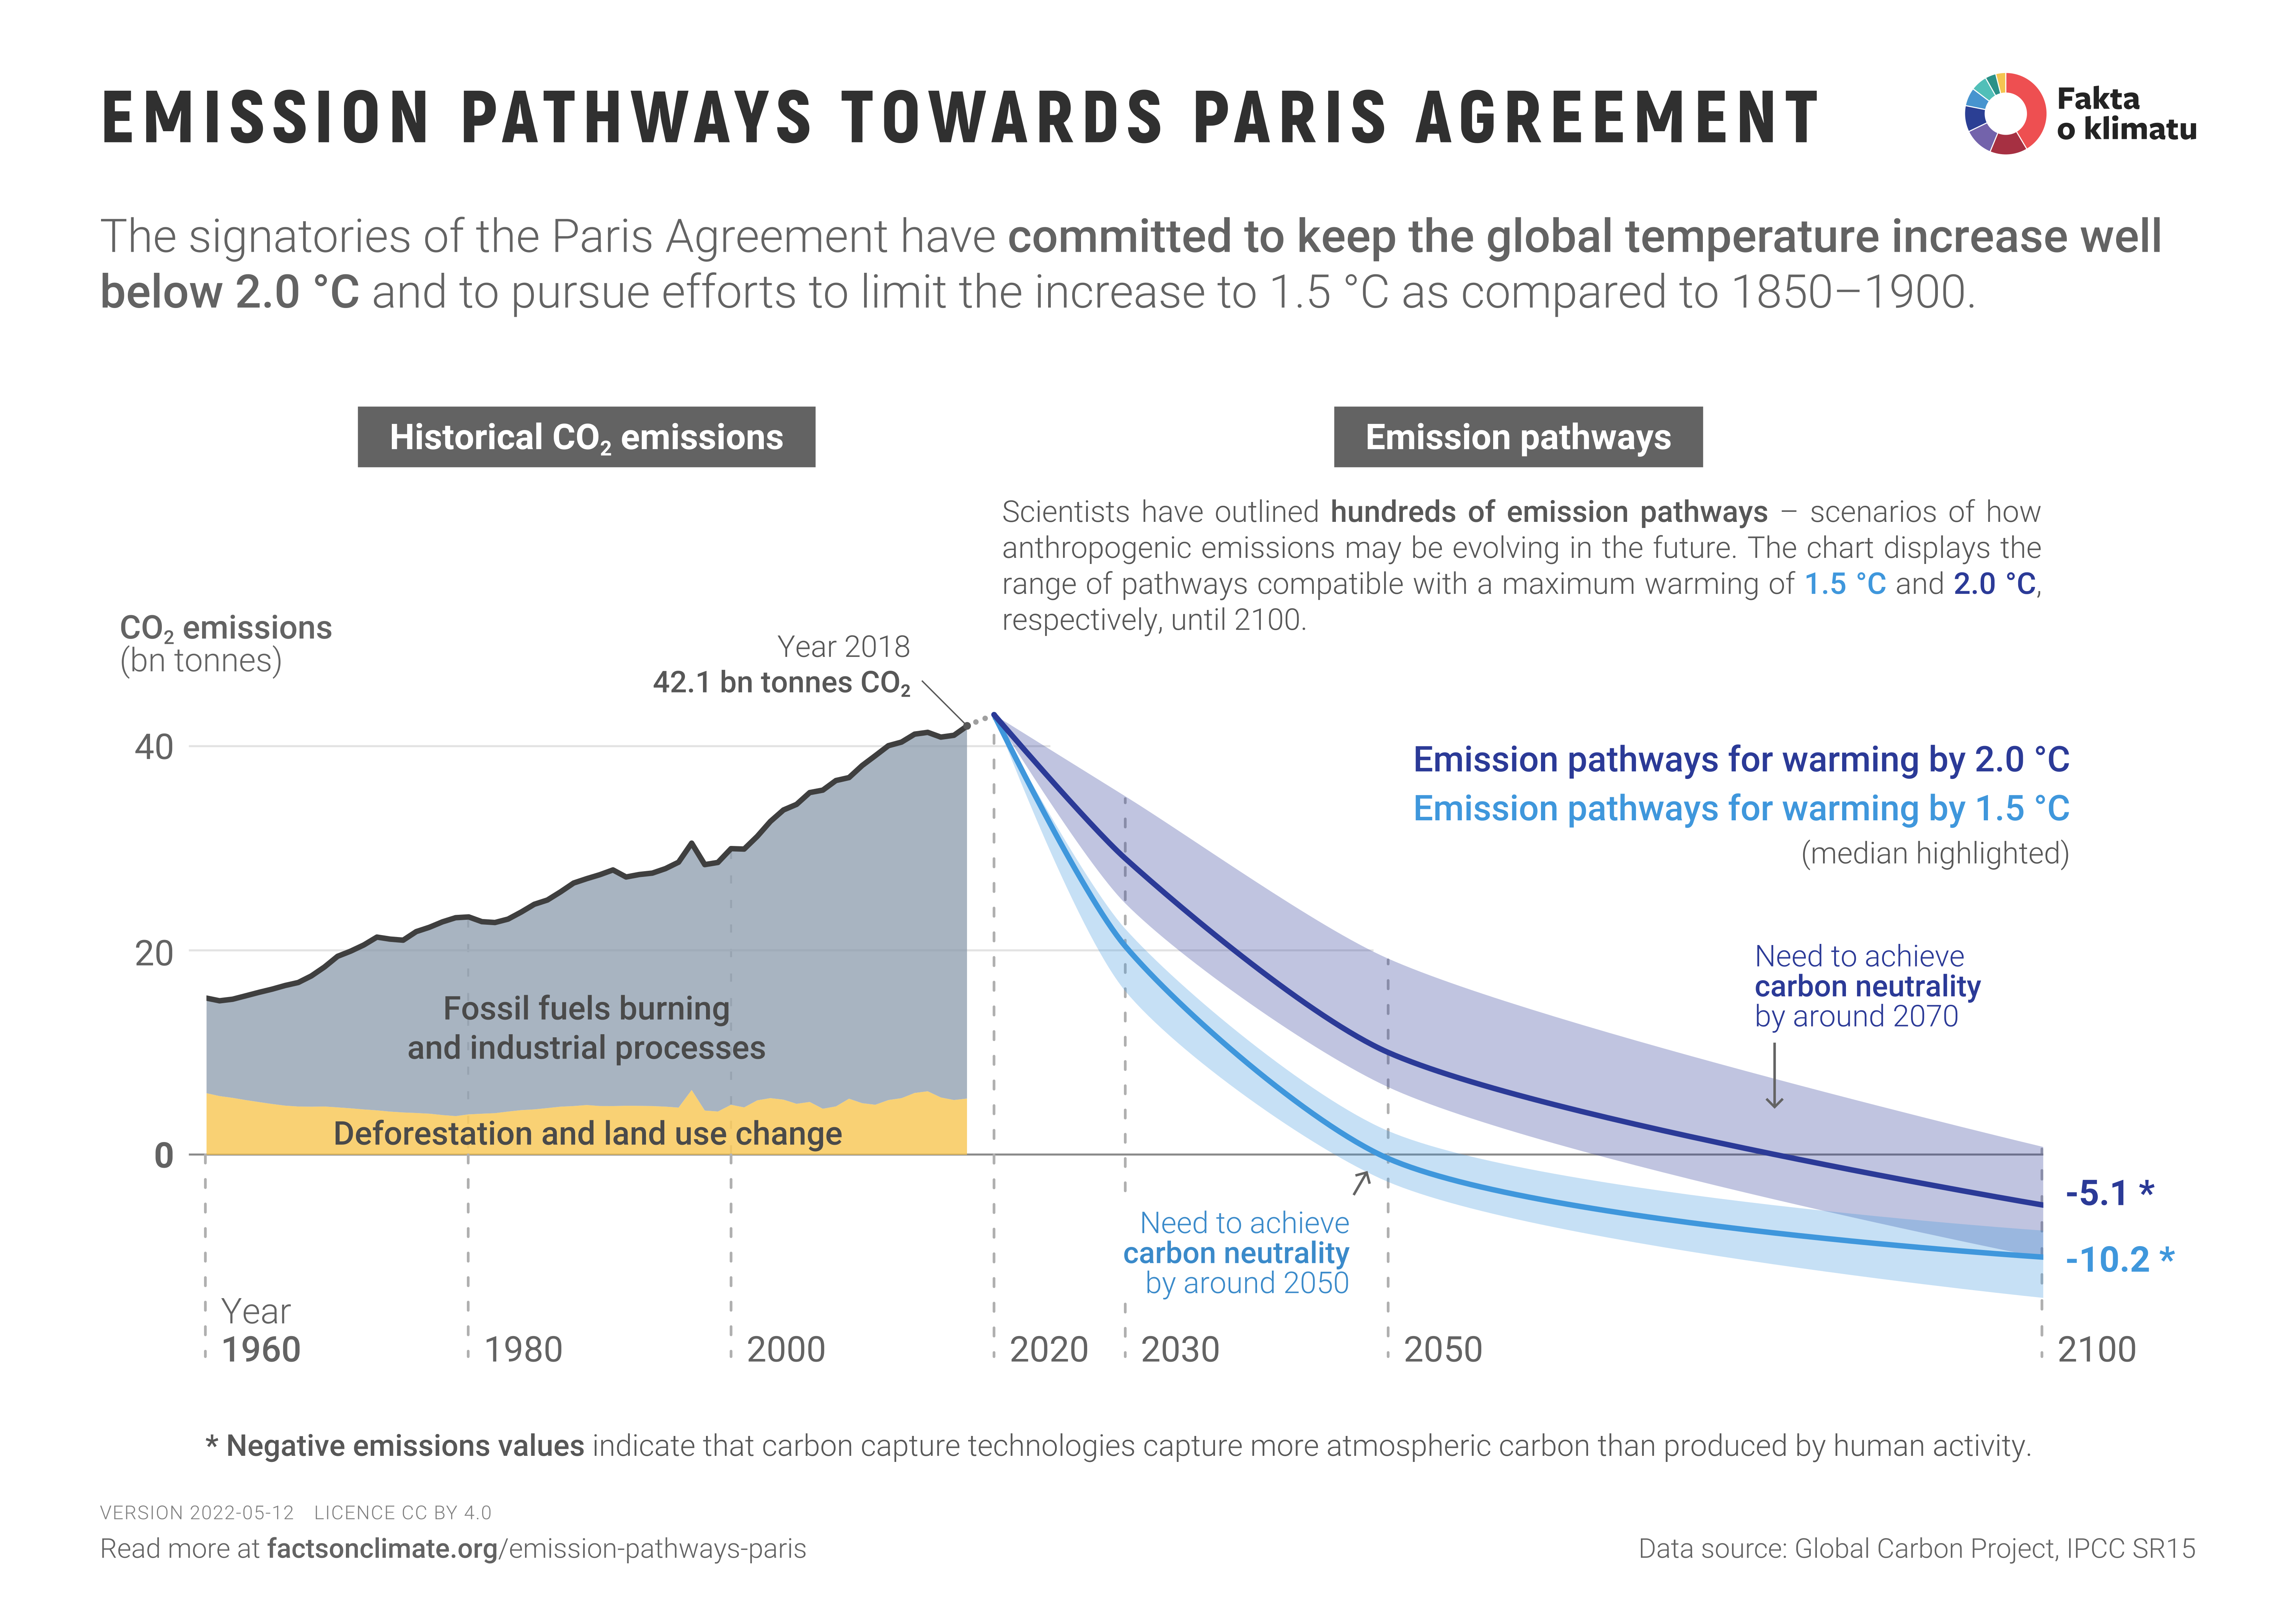
If we are to keep the rise in mean global temperature below levels that will not cause large-scale destruction of the environment, we must substantially reduce our greenhouse gas emissions. The pathways aiming to limit the global temperature increase below 1.5 °C (above pre-industrial levels) expect human emissions of CO2 to be cut in half by 2030 and net zero to be achieved by 2050. Staying below 2 °C would require these emissions to be reduced by 25% by 2030 and net zero to be reached around 2070.
Table of Contents
The purpose of this graphic is to compare the development of CO2 emissions to date and the future scenarios. These future scenarios could prevent the planet from warming by more than 1.5 °C or more than 2 °C by 2100 and meet the target set by the countries under the Paris Agreement. The graphic can serve as a primary basis or framework for discussion, but it does not include many methodological details or nuances that we discuss in more detail below.
What are emission scenarios?
Emissions scenarios are possible variations on the future development of humanity’s emissions, often involving many variables – from the growth of the number of people on the planet and the demand for electricity to the possible expansion of wind farms and other technologies. From the development of greenhouse gas emissions, the future development of greenhouse gas concentrations in the atmosphere can be calculated (e.g., RCP), which then serves as the primary input data for climate models. In other words, we can estimate the result of warming for each future emissions scenario.
Of course, there are other emission scenarios than those shown in the graph. For example, the “business as usual” scenario assumes that CO2 emissions will not be curbed and will continue to grow at their current rate. In this scenario, we would reach a CO2 concentration of around 1000 ppm around 2100 and an average warming of the planet of almost 5 °C compared to the pre-industrial period by the end of the century.
Why is only the development of CO2 emissions shown and not emissions of other greenhouse gases (methane, N2O)?
Carbon dioxide emissions account for about three-quarters of the resulting greenhouse effect. The remaining quarter is due to methane (CH4), nitrous oxide (N2O), and other gases (SF6, CFC, HFC). It is common practice to convert the emissions of these other greenhouse gases to an equivalent amount of CO2, which is then denoted by the unit CO2eq. To illustrate: while carbon dioxide emissions were approximately 42.1 billion tonnes of CO2 in 2018, emissions of all greenhouse gases, including methane, nitrous oxide, and others, were 55.3 billion tonnes of CO2eq. We usually show emissions of all anthropogenic greenhouse gases (CO2eq) in our materials – so why make an exception in this graphic?
Future emission scenarios assume different emissions of different greenhouse gases, which we could visualise, but the result would be complicated and confusing for many people. Therefore, we only show the course of CO2 emissions in a simplified manner, which plays the most significant role in global warming.
The scenarios shown assume a decrease in methane emissions by approximately a half around 2030 and subsequent stabilisation. In the case of N2O, a decline to about 80% and subsequent stabilisation. That means, we don’t expect the achievement of zero emissions for either methane or N2 O – only a reduction compared to today’s situation. A reduction is a reasonable assumption, as methane and N2O are mainly produced in agriculture (cattle farming, rice cultivation, fertilisers) and, therefore, cannot be expected to be fully eliminated. For a more detailed discussion of the development of emissions of these gases, see the graph in IPCC SR15 or the full discussion of mitigation potential scenarios in chapter 2 of IPCC SR15.
What do the historical CO2 emissions include?
The source of historical emissions data is the Global Carbon Project, which seeks to inventory all available data on anthropogenic greenhouse gases and their cycles. The data displayed includes:
- emissions from burning fossil fuels (coal, oil, gas),
- emissions from industrial processes (mainly cement production, but also other oxidation processes),
- emissions from deforestation and land-use change (this category includes not only the clearing of tropical or other forests and forest fires but also changes in the amount of organic carbon fixed in the soil, afforestation and other human-induced changes in land use. Estimating these emissions from land use change requires more complex modelling, and the values reported are the average of several models).
For a detailed methodological discussion, see Global Carbon Budget 2019.
Why did the Paris Agreement target limiting warming to 1.5 °C or 2 °C?
The full quote from the Paris Agreement reads: “This Agreement, in enhancing the implementation of the Convention, including its objective, aims to strengthen the global response to the threat of climate change, in the context of sustainable development and efforts to eradicate poverty, including by: Holding the increase in the global average temperature to well below 2°C above pre-industrial levels and pursuing efforts to limit the temperature increase to 1.5°C above pre-industrial levels…” (see the Paris Agreement).
Given that warming has now reached about 1.2 °C above pre-industrial levels and emissions are continuing to rise, the goal of keeping temperature increases below 1.5 °C is at the limit of achievability, and the pursuit of keeping temperature increases below 2 °C is very ambitious. But at the same time, warming around 2°C may already exceed many ecosystem tipping points and significantly negatively impact humanity. The IPCC SR15 report compares the impacts of 1.5 °C, 2 °C and 3 °C warming in more detail and our graphs summarise the tipping points.
What is the basis for estimates of future emissions to meet the Paris Agreement targets?
Emission scenarios for limiting warming to 1.5 °C and 2 °C, respectively, are discussed in detail in the second chapter of the IPCC SR15 report. The authors compiled the outputs of over a hundred emissions scenarios and compared the warming they caused through global climate models. The areas shown in the graphic represent the emissions ranges in those scenarios that reached the 1.5 °C and 2 °C warming thresholds, respectively, with the line representing the median.
How can such a reduction in CO2 emissions be achieved?
The primary way we can radically reduce CO2 emissions is to stop using fossil fuels (coal, oil, gas) in transport, industry and energy. Electricity and heat production contributes most to total emissions and is currently largely dependent on coal. Moving away from fossil fuels requires shifting to low-emission energy production, i.e., using renewable sources (solar, wind) or nuclear power.
An essential mechanism for transitioning over to a low-carbon economy are greenhouse gas pricing schemes that create economically favourable conditions for low-carbon technologies. An example is the Emissions Trading System (ETS), introduced by the European Union in 2005. This system obliges coal-fired power plants, iron and steel works and other greenhouse gas emitters to cover their production with allowances. The companies obtain one part of the allowances free of charge, while the other is auctioned on the market. The quantity of allowances issued each year is limited and gradually decreasing. As the price of allowances rises, companies are motivated to reduce their emissions. As a result, burning fossil fuels is no longer profitable. For example, some coal-fired power plants are being decommissioned and replaced by more environmentally friendly energy sources such as solar or wind. Companies that choose to reduce emissions the most can also make a profit by selling their emission allowances. Some other countries, including China, Australia and some US states, are introducing similar systems of charging for emissions.
![Why is global warming above 1.5 °C a problem? [2/3]](/assets/generated/tipping-points-2_600.png "Why is global warming above 1.5 °C a problem? [2/3]")
![Why is global warming above 1.5 °C a problem? [1/3]](/assets/generated/tipping-points-1_600.png "Why is global warming above 1.5 °C a problem? [1/3]")
![Why is global warming above 1.5 °C a problem? [3/3]](/assets/generated/tipping-points-3_600.png "Why is global warming above 1.5 °C a problem? [3/3]")