Emissions & carbon pricing: world
It is not just the European Union that makes greenhouse gas emitters pay – carbon taxes and emission trading systems have also been established in many other countries around the world.
Table of Contents
How to read the infographic
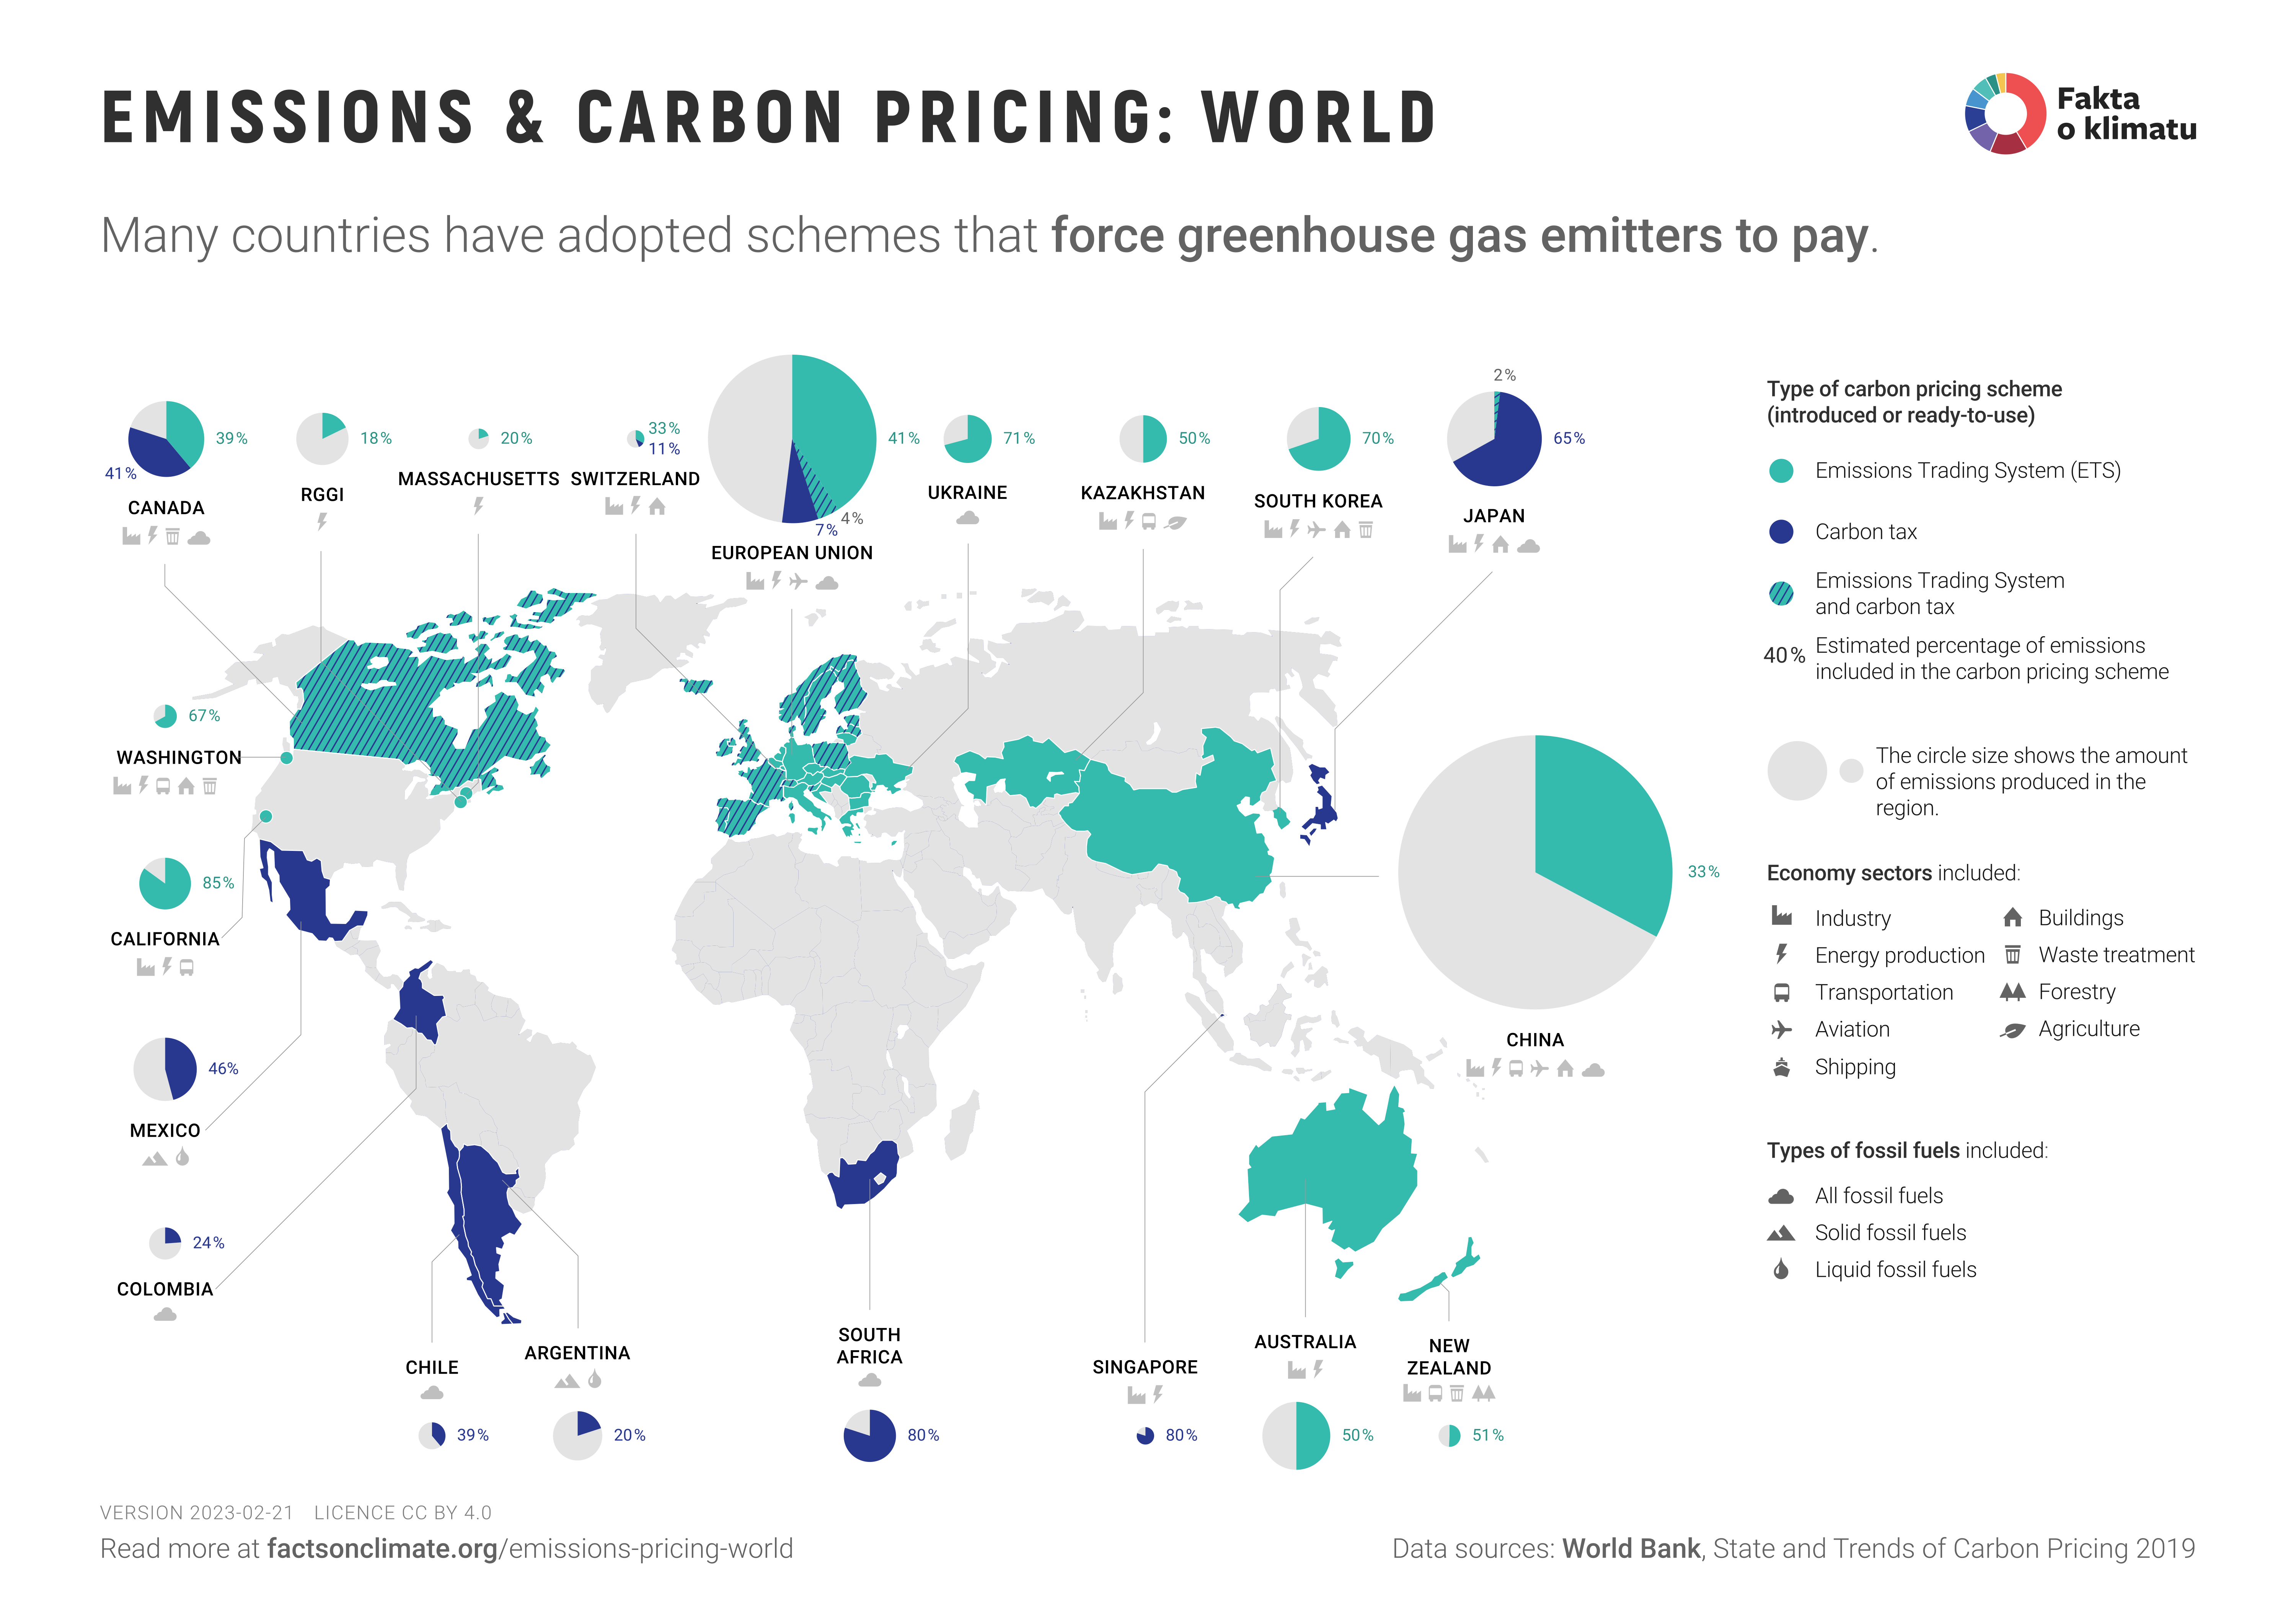
This infographic shows the total emissions for a country or region, expressed as the size of a circle. The coloured box indicates the amount of emissions covered by a carbon tax or an emission allowance scheme, and the colour, or combination of colours, corresponds to the type of measures implemented. The symbols illustrate the economic sectors affected by the measures.
The area of the largest circle (China) corresponds to 12.4 Gt CO2eq and the size of the smallest circle (Switzerland) to 0.05 Gt CO2eq. Individual measures have been divided into emission trading systems (ETS) and carbon tax, depending on how they effectively work. Approaches to carbon pricing have evolved in recent years and some cannot be directly assigned to one of the categories described here. The authors acknowledge that a different categorisation may apply.
More details on individual countries
- Canadian measures include both components of the federal system (ETS and carbon tax) as well as provincial measures that charge for carbon emissions.
- The RGGI (Regional Greenhouse Gas Initiative) was the first greenhouse gas pricing measure in the United States and now involves ten northeastern states.
- The European Emissions Trading Scheme also includes Norway, Iceland and Liechtenstein. In addition to an across-the-board ETS, some EU countries have implemented a carbon tax.
- Japan’s system includes the Satiama Prefecture ETS and the Tokyo ETS.
- China has eight pilot emission trading systems in operation so far, with a national ETS to be launched in 2020. The coverage is based on preliminary unofficial estimates from an announcement by the State Development and Reform Commission of the People’s Republic of China. The national ETS will initially cover only the power sector, with other sectors covered by individual pilot emission trading systems.
The study used in this infographic
We took the infographic from a study published in 2019 by the Global Climate Change Group of the World Bank Group. The study maps 57 initiatives for charging emissions at the state and regional levels and describes which countries choose which measures and how they implement them. The most important conclusions of the study:
- Greenhouse gas pricing initiatives cover 20% of global emissions.
- The number of initiatives is growing rapidly, with 38 implemented in the last 10 years.
- 51% of covered emissions are below $10 per tonne CO2eq, while the price that would have led to meeting the Paris Climate Agreement targets is $40-$80 per tonne CO2eq, depending on location, which in effect meets only 5% of covered emissions. Sweden has introduced the highest unit price at $127 per tonne CO2eq.
- The study also newly looks at so-called implicit emissions pricing, which includes, for example, higher taxation of fossil fuels. Therefore, the total share of emissions covered by any legislation is still slightly higher than the 20% mentioned above.
The study is also summarized in a short interview with Celine Ramstein, one of the study’s authors.
What does this infographic bring to the discussion?
Emissions pricing measures are generally considered effective tools for achieving climate goals. However, without context and background, it is difficult to see how widespread these measures have become and which countries have not yet introduced any greenhouse gas pricing measures. The graphic can help to shift the debate away from arguments such as “China needs to do something first” to questions such as:
- How high is the price of emissions in each country?
- What effect has the introduction of the measure had on the country’s emissions and economy?
- How can the introduction of measures in other countries be influenced?
- Is it possible to link emissions trading schemes and introduce a single international price or carbon tax?
Financial instruments for mitigating climate change are discussed in more detail in an International Monetary Fund study.
Commentary: European Emissions Trading System
The European ETS was launched in 2005 as the first international emissions trading scheme and covered 45% of the EU’s greenhouse gas emissions, primarily in the energy, heavy industry and aviation sectors. After a pilot test, a second phase was launched in 2008 with a reduction in the number of allowances, with some non-EU countries (Iceland, Liechtenstein and Norway) also joining. The number of allowances in the second phase was adjusted according to actual emissions. Still, the economic crisis in 2008 caused a drop in production, thereby also a decline in greenhouse gas emissions and, consequently, the price of emission allowances.
The third phase was launched in 2013 and brought several other changes – emission allowances were issued in an auction, the maximum amount of allowances wes set at the level of the entire European Union, and the sectors were expanded. The amount of auctioned allowances is reduced each year, and total emissions fall in line with this reduction. In the fourth phase, starting in 2021, the number of allowances will be reduced more rapidly. This year, emissions will be 21% lower than in 2005, and in 2030, the number of allowances (and therefore also emissions) will be 43% lower. Emissions reductions in sectors covered by the European ETS are faster than in other sectors. The price of European emission allowances can be found under the symbol EUA. At the beginning of 2020 the price was approximately €24 per tonne of CO2eq.
Source and License
This infographic was not produced by the World Bank and should not be considered official. The World Bank assumes no responsibility for the content or any errors in this infographic. Original source: State and Trends of Carbon Pricing 2019, World Bank, Washington, DC. DOI: 10.1596/978-1-4648-1435-8. License: CC BY 3.0 IGO.


