Global CO₂ emissions from fossil fuels & cement production
Global CO2 emissions from burning coal, oil and gas have quadrupled over the past 60 years. These emissions will have to be reduced to almost zero if we are to achieve carbon neutrality.
Table of Contents
How to read this graph?
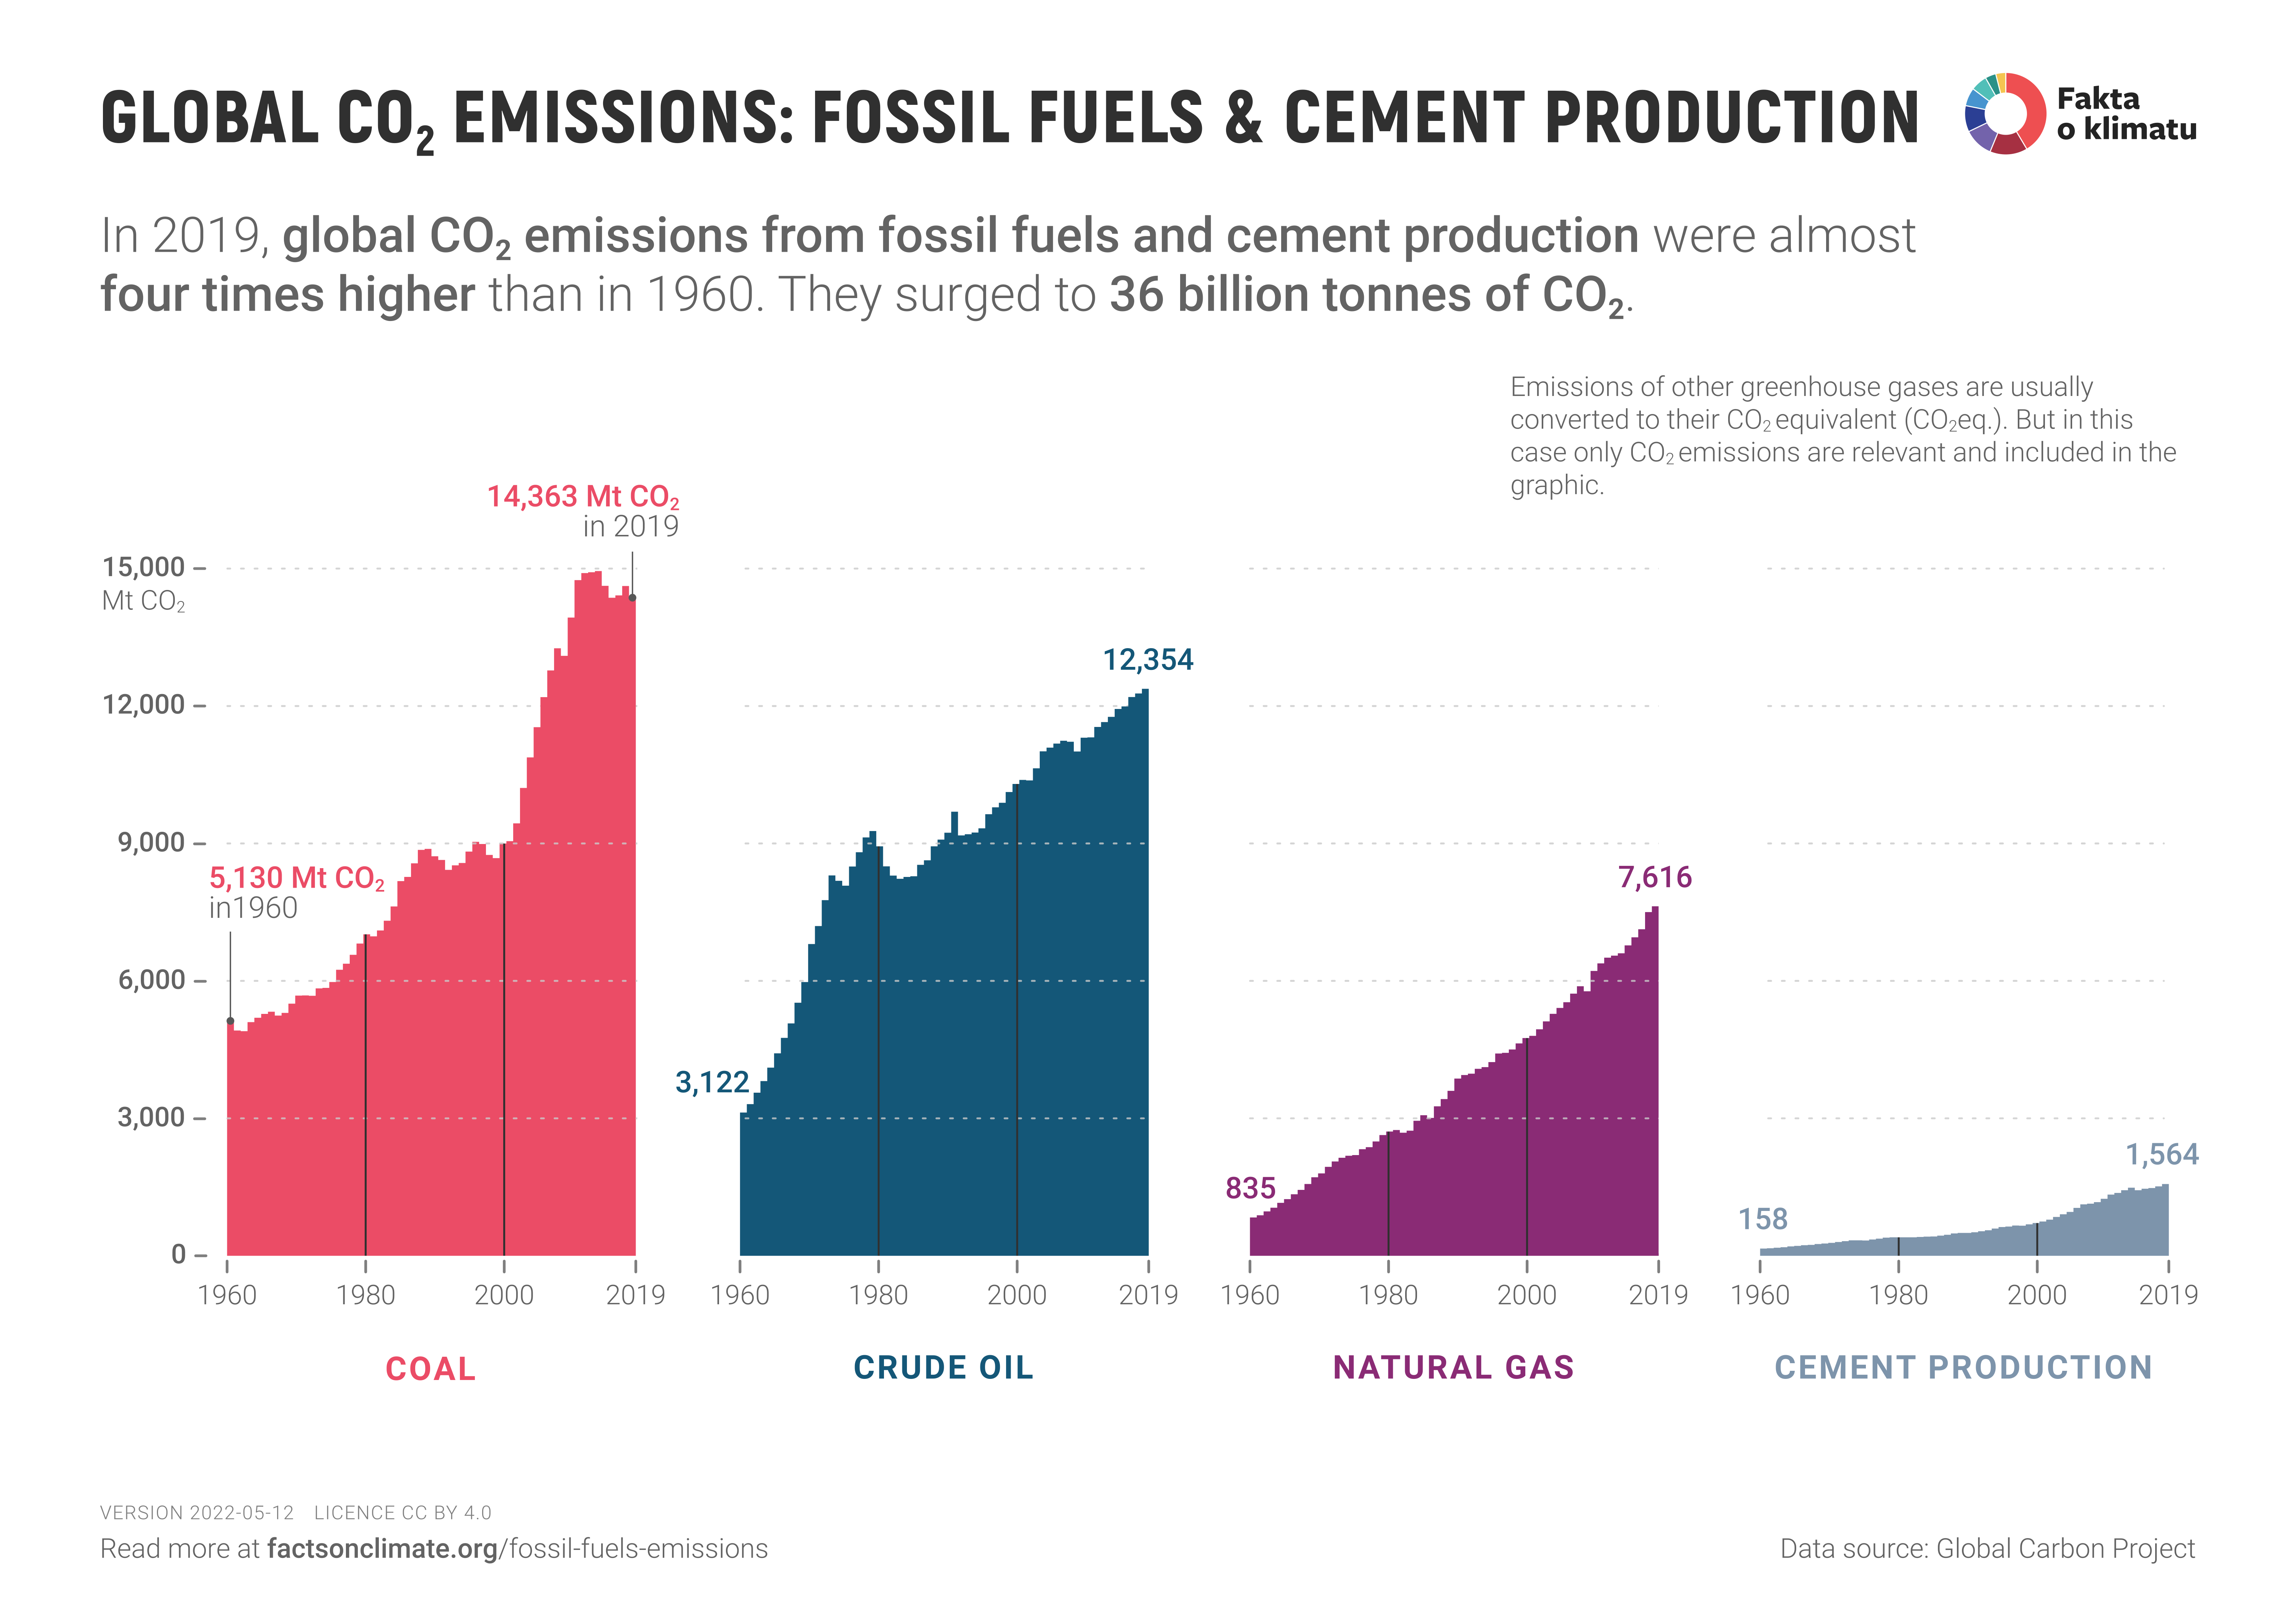
- The graph shows worldwide emissions from burning coal, oil and natural gas and, for comparison, emissions from cement production. Total emissions from these sources for 2019 were 35,897 million tons of CO2.
- The graph only shows emissions from the chemical reaction CaCO3 + heat → CaO + CO2 as emissions from cement production. Emissions created by burning coal or gas for heating are counted as emissions of the respective fuel.
More about individual fuels and cement
Coal
- Usage: Primarily for the production of electricity and heat (Map of the world’s coal power plants) in the iron or glass smelting industry or other heating.
- Mining and Transportation: In 2019, the world mined approximately 8 billion tons of coal. China (46% of world production) mined by far the most coal, followed by India (10%), the USA (8%), Indonesia (8%) and Australia (6%). Unlike oil and natural gas, which may be transported by pipelines, coal must be brought to the point of consumption by vehicles.
- The graph shows a remarkable increase in coal consumption after 2000 caused by the industrialization of China, India and other Asian countries. Coal consumption in Europe and the USA has been declining in recent decades.
Petroleum
- Usage: The majority of oil – or, more accurately, the gasoline and diesel produced from oil – is burned in transportation. The use of oil for heating is relatively rare.
- Extraction and transportation: The world produces about 100 million barrels of oil daily, or about 5 billion tons per year (2019). Most oil is produced in the countries of the Persian Gulf (about 32% of world production), followed by the USA (15%) and Russia (13%). While the US covers its consumption with production, most other major oil producers export their production. Approximately 61% of crude oil is transported by ship, with the remainder transported by pipelines.
- The graph shows the several-year decline in consumption after 1979, caused by the oil crisis after the revolution in Iran and the subsequent war between Iran and Iraq. At that time, world production fell by about 4%, and oil prices doubled.
Gas
- Usage: Electricity and heat production in households (heating, cooking, water heating) and industry.
- Extraction and transportation: In total, 4000 billion m3 were extracted in 2019, i.e. about 3.2 billion tons of natural gas. The largest producers include the USA (21% of world production), Russia (17%) and the Gulf States (together 18%). Transportation of natural gas occurs through pipelines and ships carrying liquefied gas.
- Burning natural gas is significantly more efficient than burning coal for generating electricity. IPCC estimates the emission intensity of natural gas in the range of 410-650 g CO2eq/kWh (including extraction and transport); for coal combustion, it indicates a range of 740-910 g CO2eq/kWh. This fact represents an important reason for the so-called coal phase-out, which occurs when a combination of renewable energy sources and gas-fired power plants replaces coal-fired power plants.
- In addition to CO2 emissions from combustion, natural gas extraction and transport also produces methane emissions. These are mainly gas leaks during mining estimated at around 100 million tons of CH4 per year, equivalent to about a third of anthropogenic methane emissions.
Cement
- Cement is produced by heating a mixture of limestone and clay to temperatures of around 1450 °C. This heating also causes limestone to decompose into calcium oxide and carbon dioxide. Approximately half of the total CO2 emissions from cement production arise from the CaCO3 + heat → CaO + CO2 chemical reaction. The other half of the total emissions relates to coal or gas combustion in production. In the graph, the category cement only shows emissions from the chemical reaction. The emissions related to coal and gas combustion in cement production are reported under the categories for those fossil fuels.
- The total emissions from cement production (including heating fuels) are approximately 2.8 billion tons of CO2, or about 8% of world CO2 production. If the cement industry were a country, its emissions would be the third largest in the world, after China and the USA.


