Table of Contents
Basic Interpretation (How to read this graph?)
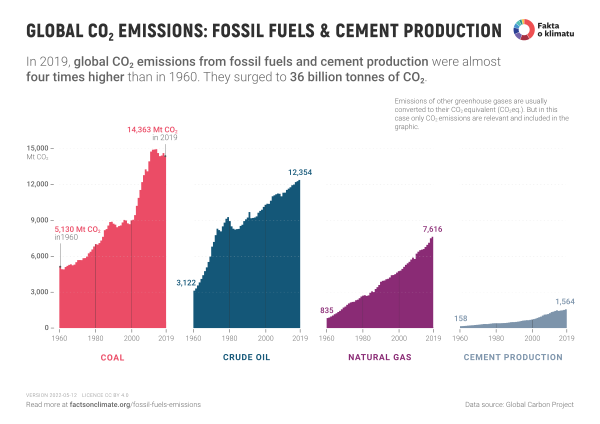
CO2 emissions from coal, oil and gas combustion
burns about 8 billion tons of coal, 5 billion tons of oil, and about 3 billion tons of natural gas annually.
-
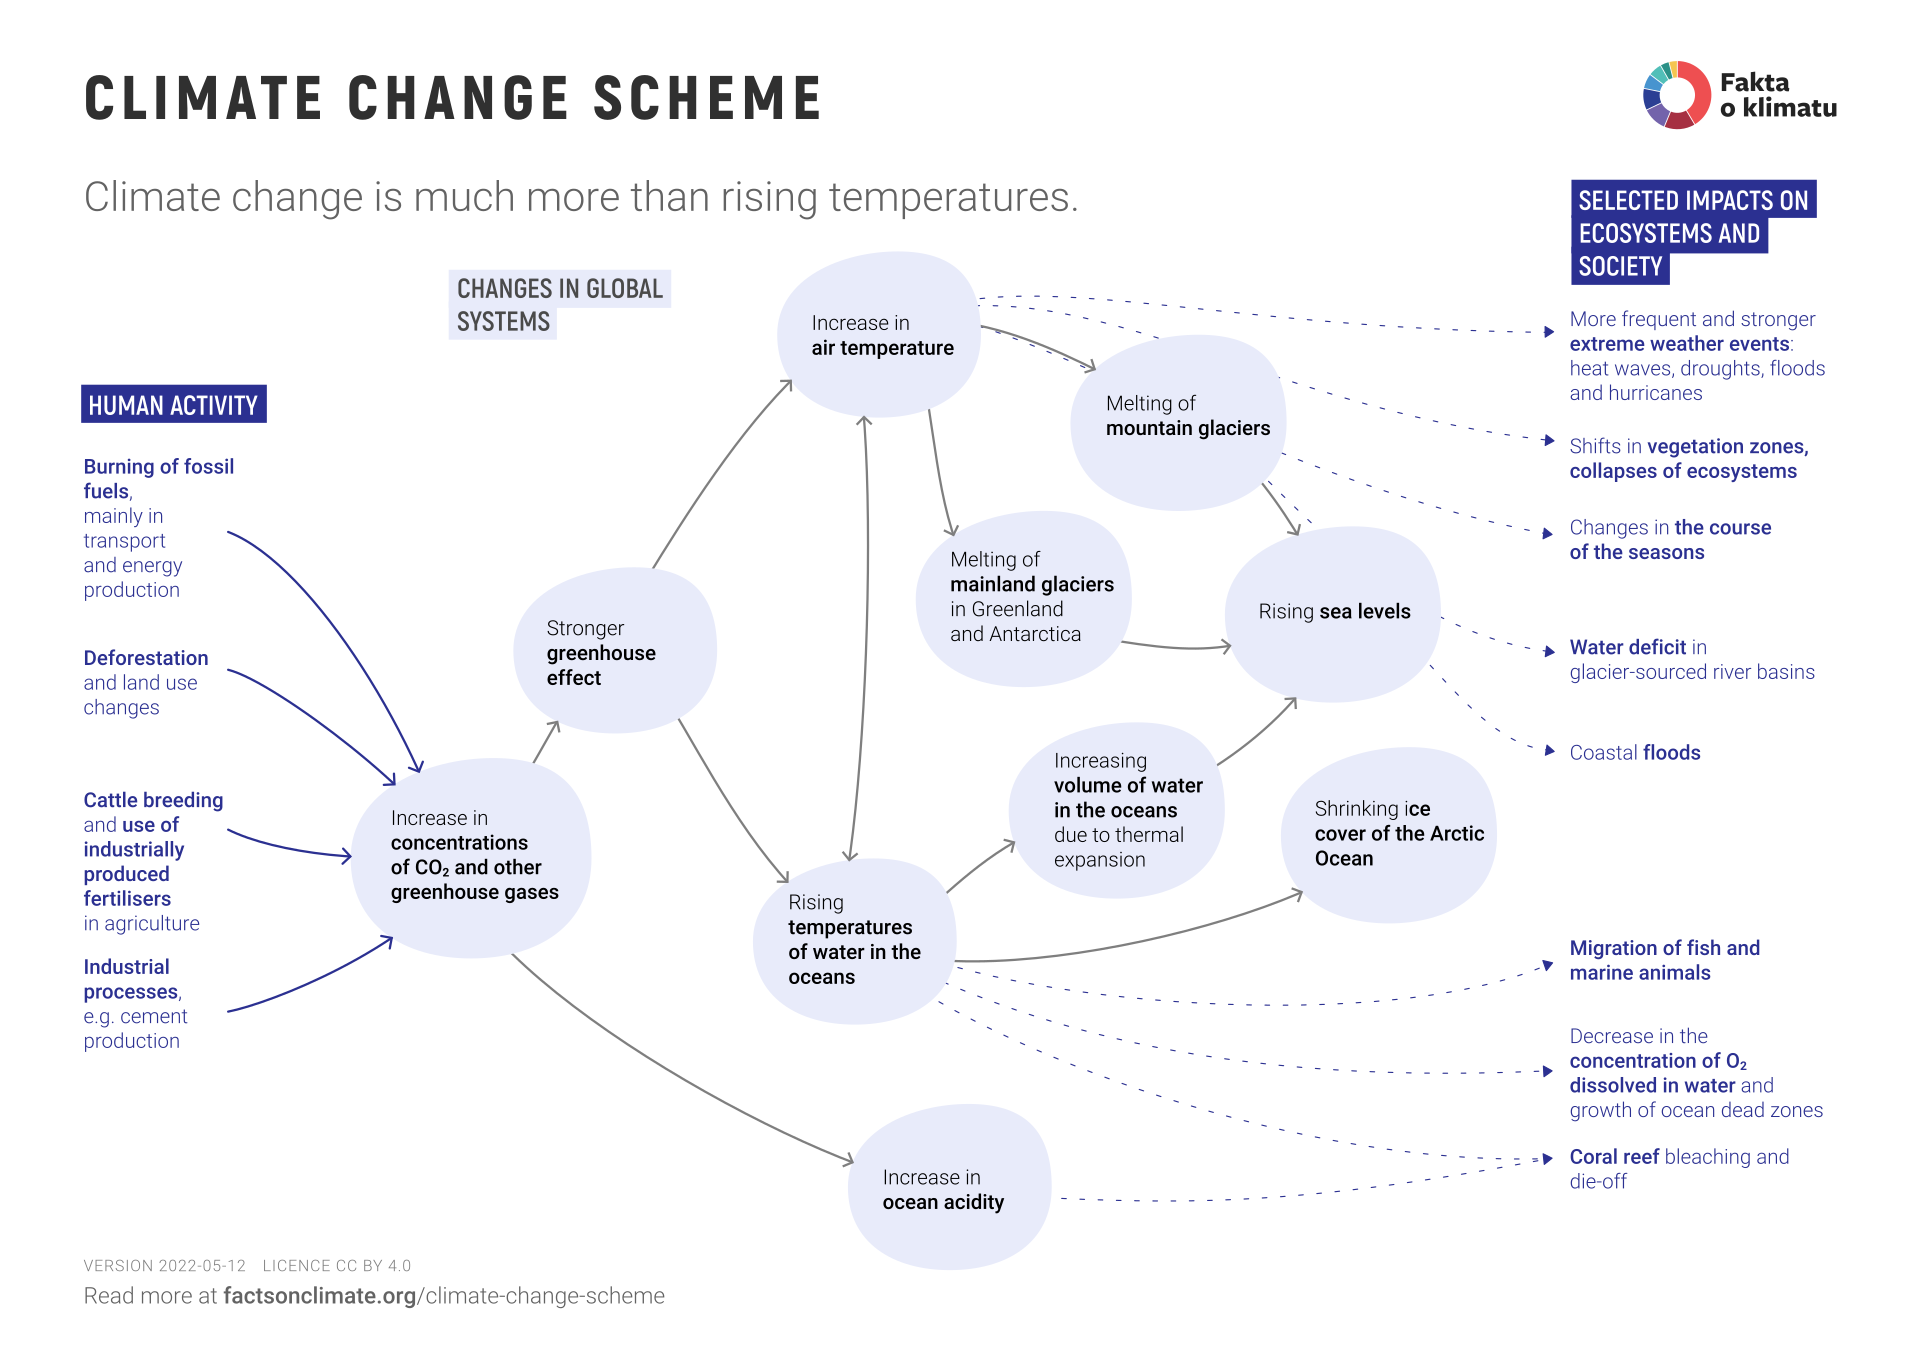
Human activity led by burning fossil fuels (coal, oil and natural gas) leads to an increase in the concentration of carbon dioxide (CO2) in the atmosphere. About 35 billion tons are produced annually in energy, transport and industry, while deforestation adds another 5 billion tons. The average inhabitant of the planet, therefore, accounts for about 5 tons of CO2 per year. Human activity thus leads to increased CO2 concentrations in the atmosphere. In addition to CO2, greenhouse gases also include methane (CH4) and nitrous oxide (N2O), which arise in agriculture during cattle breeding, rice cultivation or the use of industrial fertilizers.
-
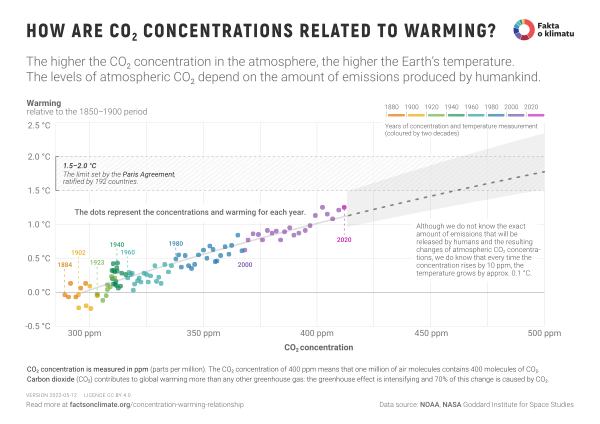
Higher concentrations of CO2 and other greenhouse gases in the atmosphere lead to a more potent greenhouse effect. Heat radiation, which would otherwise be emitted by planet Earth into space, is absorbed by greenhouse gases and returned to the surface. The earth is therefore warming.
-
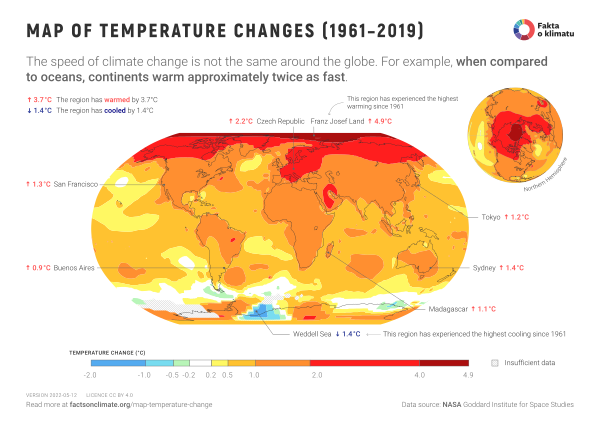
The intensified greenhouse effect leads to the warming of air and ocean water. Since the industrial revolution, air temperatures have risen by an average of 1.2°C. Still, most of the heat has been absorbed by ocean water, whose temperature has also been rising for a long time. Temperature change is different in different places - the northern polar regions are warming four times faster than the oceans (see Temperature Change Map).
-
The warming of the planet leads to more frequent heat waves, stronger hurricanes, more severe and longer dry periods, but also to heavier rains and floods - that is, to more frequent occurrences of extreme events.
-
Atmospheric CO2 partially dissolves in the ocean, where it forms carbonic acid. This leads to a drop in pH, or ocean acidification, which is dangerous for corals and other marine life.
-
Warmer seawater temperatures are causing a reduction in the area and thickness of sea ice in the Arctic Ocean. In September 1979, the ice volume in the Arctic Ocean was about 17,000 km3; in September 2017, it was only 5,000 km3. The first summers during which the entire Arctic Ocean will thaw are expected to arrive around 2050.
-
The level of the world’s oceans is rising at a rate of 3.3 cm per decade. About half of this is caused by the melting of mainland glaciers, the other half of the rise in levels is due to the warming of seawater - like any other material, seawater also increases its volume with temperature.
-
Rising temperatures are also behind the melting of mountain glaciers in the Alps, Himalayas, Andes and other world mountain ranges. This will significantly impact agriculture and water supplies, as rivers in many areas of the world are fed by melting mountain glaciers.
More detailed discussion of the scheme and some of its simplifications
This scheme is intended to serve as a basic orientation in the issue of ongoing climate change and, therefore, cannot show the full complexity of the problem. We will consequently mention in more detail on the aspects in which the scheme is simplistic or requires further comment.
- The diagram captures a long-term view (climate) and does not focus on short-term changes (weather). Likewise, it does not show the dynamic nature of the flow in the atmosphere and oceans, which fundamentally affects the distribution of heat and precipitation. To capture the dynamic nature in more detail, computer climate models are needed that model the temporal evolution of atmospheric and ocean currents and their interactions. In the diagram, this dynamic influence is only indicated by a double-sided arrow between air temperatures and ocean temperatures.
- The diagram does not show so-called cyclical feedbacks, such as the Ice-Albedo feedback, where the melting of sea ice leads to the exposure of a free surface that absorbs more solar radiation and thus causes an increase in water temperature and further melting of the ice. This feedback is only indicated by a double-sided arrow. For example, the Wikipedia pages on Climate change feedback can serve as a practical guide.
- Carbon dioxide in the industry is produced, on the one hand, by the burning of fossil fuels during heating (smelting, distillation, drying, etc.) and, on the other hand, by specific chemical reactions, e.g., in the production of cement or iron. If emissions are classified according to these criteria, then, for example, part of the emissions from cement production will be counted as “industrial processes”, while the other part (related to high-temperature heating) will be counted as “industrial combustion”.
- A common argument challenging human influence on the climate is that ordinary water vapor is the most potent greenhouse gas. It is true. However, the amount of water vapor in the atmosphere is also influenced by human activity, albeit indirectly. The water vapor cycle is controlled by temperature, which is affected by other greenhouse gases emitted by humans. In the calculations of the strength of the greenhouse effect and the sensitivity of the climate, the influence of water vapor is taken into account.
Links to other resources
- Changes in the oceans and cryosphere: The special report of the IPCC, denoted by the abbreviation SROCC (Special report on Ocean and Cryosphere), deals in detail with changes in the oceans and cryosphere. The Wikipedia pages about rising ocean levels, ocean acidification or the arctic sea ice decline will serve better as a guide. Dead zones are areas with a lack of dissolved oxygen in the water, leading to mass fish deaths. Dead zones are created either by the overgrowth of algae due to high concentrations of phosphorus or nitrogen fertilizers in the water or by an increase in water temperature (warmer water contains less dissolved oxygen).
- Greenhouse effect: The Greenhouse effect page on Wikipedia is good for basic orientation. A more detailed explanation of the physics of the passage of radiation through the atmosphere should be found in atmospheric physics and spectroscopy textbooks. Wikipedia pages on radiative forcing and climate sensitivity will also offer additional context.
Related infographics and studies
Want to see more? Check out other topic-related infographics and studies:


