Map of temperature changes (1961–2019)
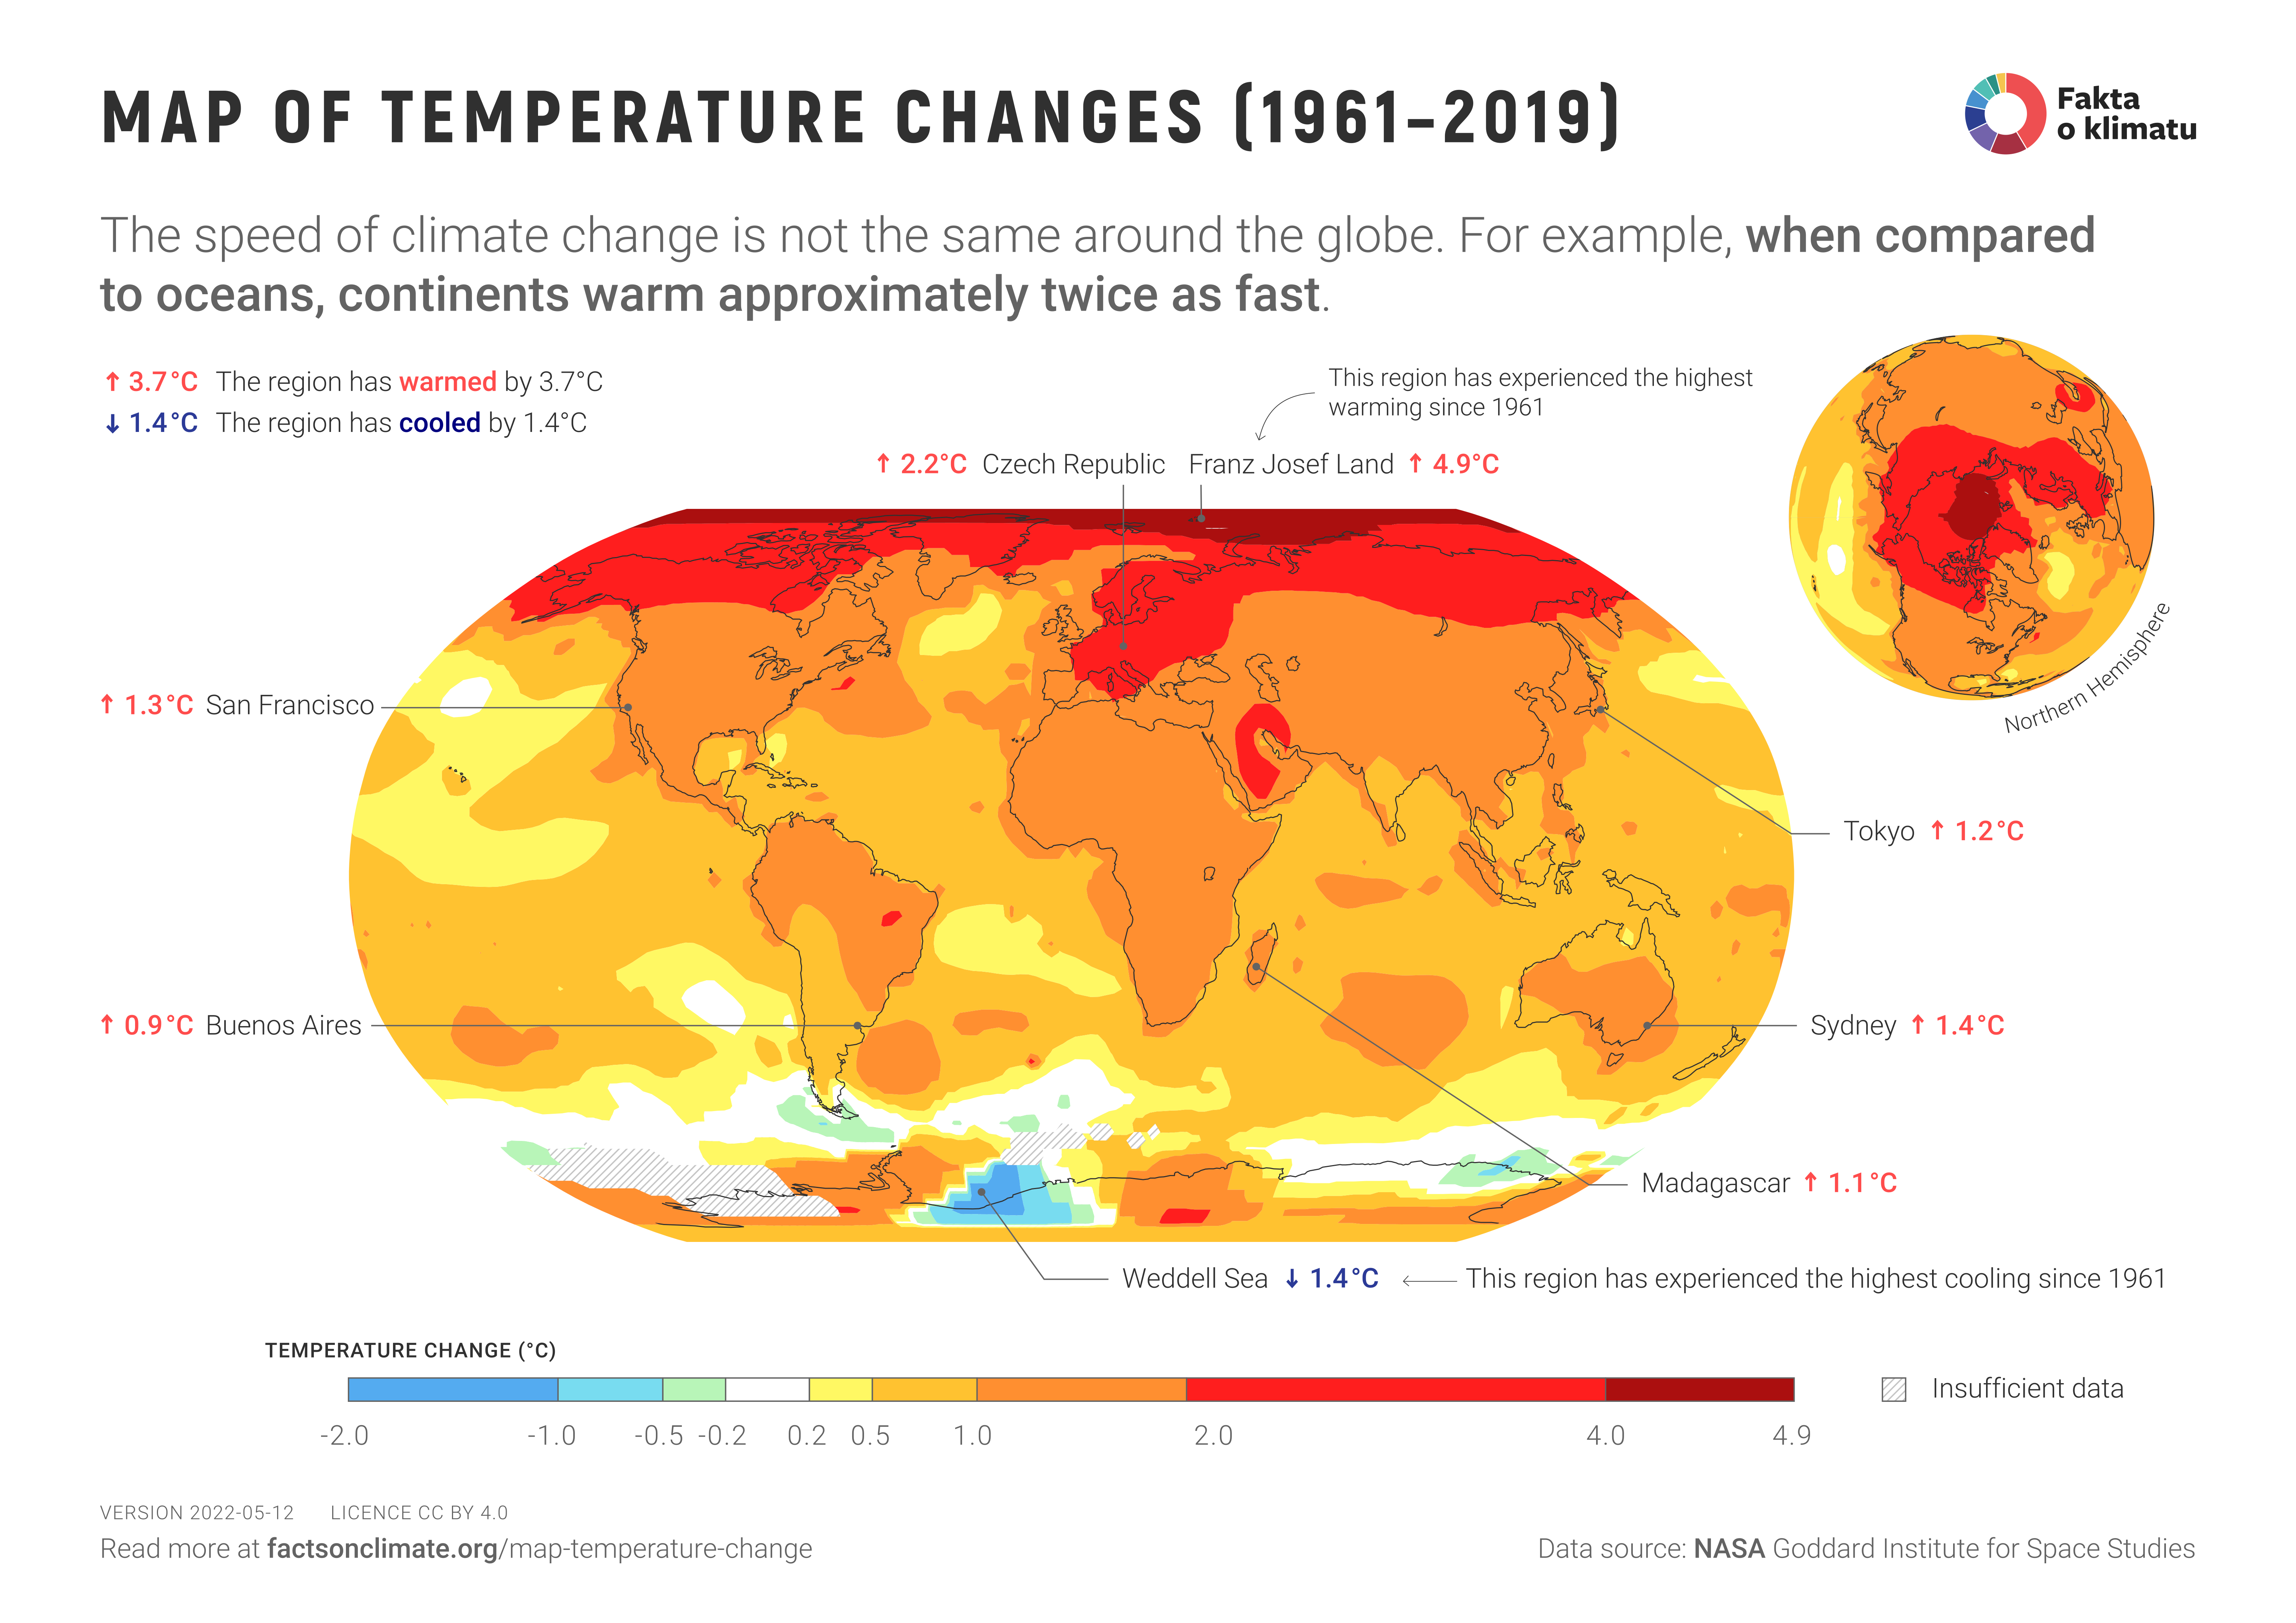
The global temperature increase since 1961 is approximately 1.1 °C. However, the warming rate is not the same for all locations: while the temperature in most of the planet's oceans has not increased by more than 0.8 °C, most of the world's land is warming considerably faster. The highest warming rate on Earth (over 4 °C in the last 60 years) is in the Arctic Ocean.
Table of Contents
Additional comments and links
-
The world has warmed by about 1 °C since 1961. However, the landmasses are warming at about twice the rate of the oceans, with the Northern Hemisphere warming faster than the Southern Hemisphere. Furthermore, warming varies at different times of the year – for example, warming in the Arctic Ocean during the winter months has exceeded +6 °C since 1961.
-
The amplification of warming over land and in the Northern Hemisphere is due to feedback in the climate system and is well modelled by current climate models. Back in 1979, the Charney Report summarized the results of climate models at the time, and the authors concluded: “When it is assumed that the CO2 content of the atmosphere is doubled and statistical thermal equilibrium is achieved, the more realistic of the modeling efforts predict a global surface warming of between 2°C and 3.5°C, with greater increases at high latitudes.”
-
The data comes from NASA GISS, which has been collecting temperature data from measuring stations on land and at sea for a long time. While this data series collection started in 1880, we decided to use data from 1961 and onwards to compare it in other infographics with the temperature data for the Czech Republic from the Czech Hydrometeorological Institute (CHMI), as it started collecting data in 1961.
-
Specific examples of places with large temperature increases are the islands in the Arctic Ocean – Spitsbergen or Franz Josef Land. In Svalbard, the average annual temperature increased by 3.7 °C, while in Franz Josef Land, it increased by 4.9 °C. An example of a location that has seen a temperature decrease (by approximately 1 °C since 1961) is Halley Station (75.45N, 26.217W) on the Weddell Sea coast. However, Antarctica as a continent is warming slightly.
-
Data from individual measurement stations can be viewed in the NASA GISS interactive application.
Data source
- GISTEMP Team, 2019: GISS Surface Temperature Analysis (GISTEMP). NASA Goddard Institute for Space Studies. Dataset accessed 2020-02-27 at data.giss.nasa.gov/gistemp.
- Lenssen, N., G. Schmidt, J. Hansen, M. Menne, A. Persin, R. Ruedy a D. Zyss, 2019: Improvements in the GISTEMP uncertainty model. Journal of Geophysical Research: Atmospheres, Volume 124, Issue 12p, str. 6307–6326, doi:10.1029/2018JD029522.

